Interactive example · Hospitality & retail
One screen over the business, and a brief that tells you what to do about it
Most owners of more than one site read the week from three POS logins, a Xero report, a roster export and the Google reviews app, on a Sunday night, and still can't say why Woodend was down. Use the version below, for a fictional group of three cafés in the Macedon Ranges: find the venue that's off, ask the brief why, and set the alert that would have told you on Friday.
In short
A custom owner's dashboard pulls sales, wages, average spend and reviews from your POS, payroll, Xero and Google into one screen per venue and for the group, lets you drill into a week by day and day part, writes a Monday brief in plain English from those same numbers that you can ask questions of, and sends alerts when a venue drifts past the thresholds you set, before the week is over.
Interactive demo: Owner's dashboard with a weekly brief
Live demo · Three Peaks Coffee, Macedon Ranges is a fictional business with sample data. Nothing you do here is saved or sent.
- Open the venue that's offWoodend is flagged. Open it and the week breaks into days and day parts, with the short days in red and the reviews beside them.
- Ask the brief whyUnder the Monday brief, ask why Woodend is down. The answer is written from the same figures as the tiles.
- Set the wages alertSet the wage threshold and save. See what it would have sent you last Friday, while Saturday's roster could still change.
- Send the brief to the managersEach manager gets their own venue's paragraph. It goes every Monday at 7 am from then on.
Three Peaks Coffee
numbers.threepeaks.com.au · Marlo Reyes, owner
Three Peaks Coffee is fictional. Venues, figures, reviews, managers and targets are sample data. The brief and its answers are scripted from those sample figures for the demo; in a real build they are generated from your data each week and can be wrong, so they cite their sources. Emails, messages and alerts are simulated.
Built for owners of cafés, venues, retail and multi-site businesses
Three people it has to work for, and what each is hiring it to do
- OwnerKnow on Monday which venue needs me, and why, without opening five apps
- Venue managerSee my own numbers against my own targets, in words I can act on
- Bookkeeper or accountantStop building the same weekly report by hand from Xero and the POS
What you just used
How Three Peaks Coffee runs, screen by screen
- Sources pulled overnightSystemPOS, payroll, Xero, reviews
- Brief written from the figuresSystemSame numbers as the tiles
How the work moves through Three Peaks Coffee: who does what, and where the software takes over. Steps with a mint mark are ones you can do in the demo above.
One screen, every source
Sales and covers from the POS, wages from payroll or the roster, invoices and bills from Xero, reviews from Google. Each venue on a tile against last week and its own targets, the group at the top, eight weeks of shape underneath.
Drill to the day part
Open a venue and the week breaks into days and breakfast, lunch and afternoon, each against what's usual for that venue on that day. The short day is red before you've read a number.
A brief written from the numbers
Every Monday, a plain-English brief: what moved, why, and what to watch. It's generated from the same figures as the tiles, so it can't say something the dashboard doesn't. The demo's is scripted; the real one reads your data each week.
Ask it questions
Why is Woodend down, which venue had the best week, what's the group wage cost, what should I do. Answers cite the figures and the sources. When it doesn't know, it says so rather than guessing.
Alerts before the week is over
Wages over a share of sales, reviews under a score, sales under a floor: checked on Friday afternoon on the week to date, so a bad Saturday roster can still be changed. Sent by SMS or email, per venue or for the group.
Managers see their own venue
Each manager gets their venue's tile, drill-in and paragraph, against their targets, and nothing else. The owner sees the group. The accountant gets the export they used to build by hand.
Built for you
Your rules, not a template's
The demo is three cafés and four metrics. Built for yours, it carries your own:
- Your sources: the POS you run (Square, Lightspeed, Kounta or another), payroll or rostering, Xero or MYOB, Google and the booking system
- The metrics that matter to your business: wage share, cost of goods, spend per head, labour hours per cover, bookings, stock, whatever you already track by hand
- Targets per venue and per day of the week, and the usual you're measured against
- The brief's voice and what it covers, and the questions it can answer, drawn from your data only
- Alert rules, thresholds and who gets them, and when in the week they run
- Who sees what: owner, managers, head office, the accountant
Connects to what you already use
Where a tool offers an API or a calendar feed, the build talks to it directly. Your data stays in accounts you own.
- Xero
- MYOB
- Square
- Lightspeed
- Deputy
- Tanda
- Employment Hero
- Google Business Profile
- Slack
- SMS
Custom build, a BI tool, or the spreadsheet?
Power BI, Looker Studio and the dashboards inside Xero or your POS all show numbers, and for one venue with one source they may be enough. The question is whether anyone will open them, whether they can explain a bad week, and whether they'll tell you before it's too late.
| Criteria | BI tool or built-in dashboard | Custom-built | The Sunday spreadsheet |
|---|---|---|---|
| Time to start | Days, if the connectors exist | Weeks to months | Already running |
| Sources | Whatever has a connector; the rest is manual | Every system you run, joined by venue and week | Copied in by hand |
| Explains the week | Charts; you do the explaining | A brief and answers written from the numbers | You, on Sunday night |
| Alerts | Sometimes, on one metric | Your rules, on the week to date, before the roster locks | None |
| Managers | A licence each, and the whole thing | Their venue, their targets, their paragraph | A screenshot in the group chat |
| Best when | One source, someone who likes building charts | Several venues or several systems, and an owner who wants answers not charts | One venue, one owner, early days |
How we'd build yours
Fixed price, agreed before we start
Sit with you on a Sunday night
We watch how you read the week today, which numbers you actually act on, and what you wish someone would just tell you.
Fix the scope and the price
A written scope: sources, metrics, targets, the brief, alerts and who sees what in the first version, with one fixed price you approve before we start.
The tiles first, from real data
The dashboard goes live on your live sources within weeks, read-only, beside the spreadsheet. You tell us where it's wrong until it isn't.
Then the brief and the alerts
The brief starts once the numbers are trusted, in your words. Alerts come last, tuned on a month of real weeks so they fire when it matters.
What moves the price
Custom work is quoted individually, at a fixed price, once the scope is written down. These are the things that make the biggest difference.
- Sources
- Xero and a modern POS are standard; older systems, exports and scraping cost more.
- Venues and metrics
- Three venues and a handful of metrics is the base; more of either adds modelling and screens.
- The brief
- A weekly brief from the figures is standard; conversational questions over more of your data is a bigger piece.
- Alerts and roles
- A few rules to the owner is simple; per-venue rules, SMS and manager roles add work.
When you shouldn't build this
If you have one venue and one POS, its own reports and a Xero dashboard will do; spend the money on the venue. Custom makes sense when you're across several sites or several systems, when the Sunday spreadsheet has become a job, when you want a brief rather than a chart, or when a bad week keeps being found a week too late. The AI brief is only as good as the data under it; we build the data first.
Want this, with your name on it?
Tell us how the work runs today. We'll reply within one business day with what we'd build first, what we'd leave out, and whether an off-the-shelf tool would serve you better.
Common questions
A single screen that pulls the numbers an owner reads each week from every system they run (POS, payroll, Xero, reviews, bookings) into one view per venue and for the group, against targets and against what's usual. A good one also explains the week in words and warns you before it's over.
The brief is generated each week from the same figures the tiles show, so it can't report a number the dashboard doesn't have. It can still describe a cause wrongly, which is why every sentence cites its figures and the questions answer from your data only. The demo's brief is scripted; a real one is generated.
Xero and MYOB, Square, Lightspeed and most modern POS systems, Deputy, Tanda and Employment Hero for rosters and wages, Google Business Profile for reviews, and booking systems with an API. Systems without one can be fed by export. We check each one in the scoping.
Not exactly. Those are chart builders that need someone to build and maintain the charts and to explain them. A custom dashboard is built around the questions you actually ask, joins your systems by venue and week, and adds the brief and the alerts. If you already have a data team and Power BI, keep it.
Yes, by role. Managers see their own venue against its targets and get their own paragraph of the brief; head office or the owner sees the group; the accountant gets the weekly export they used to build by hand, with the figures already reconciled to Xero.
More examples to try
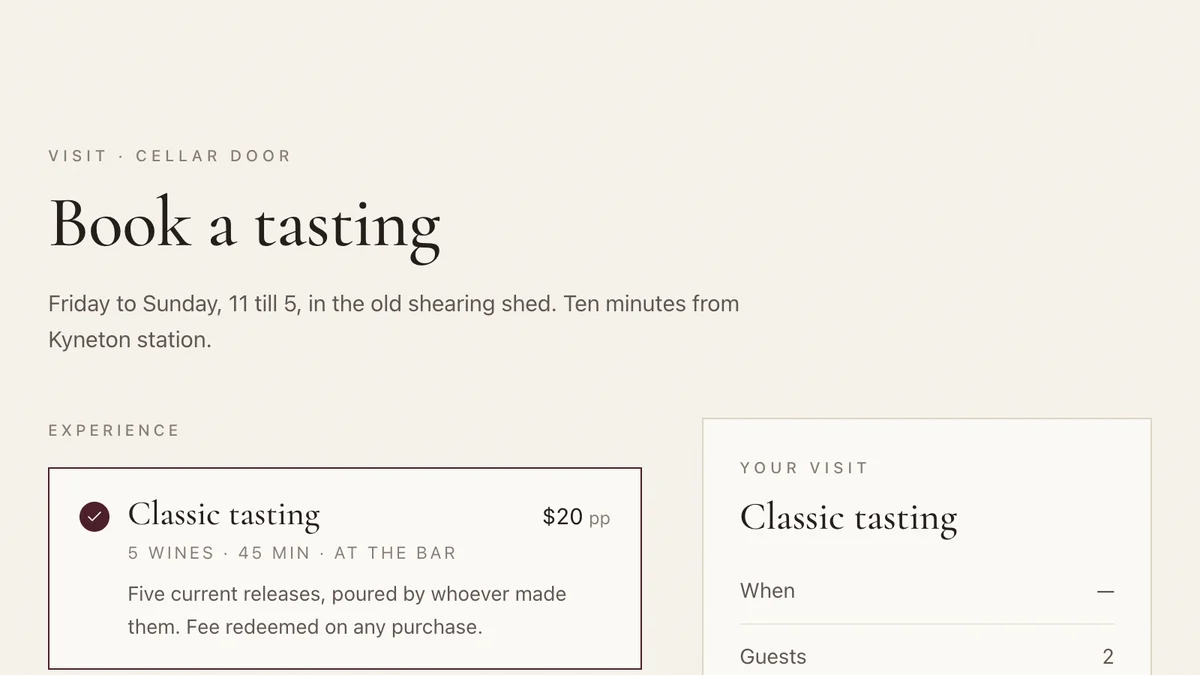
- Wineries, cellar doors and small producersCellar door and wine clubTasting bookings, club memberships and member-customised shipments for a small winery.Live demoTry it
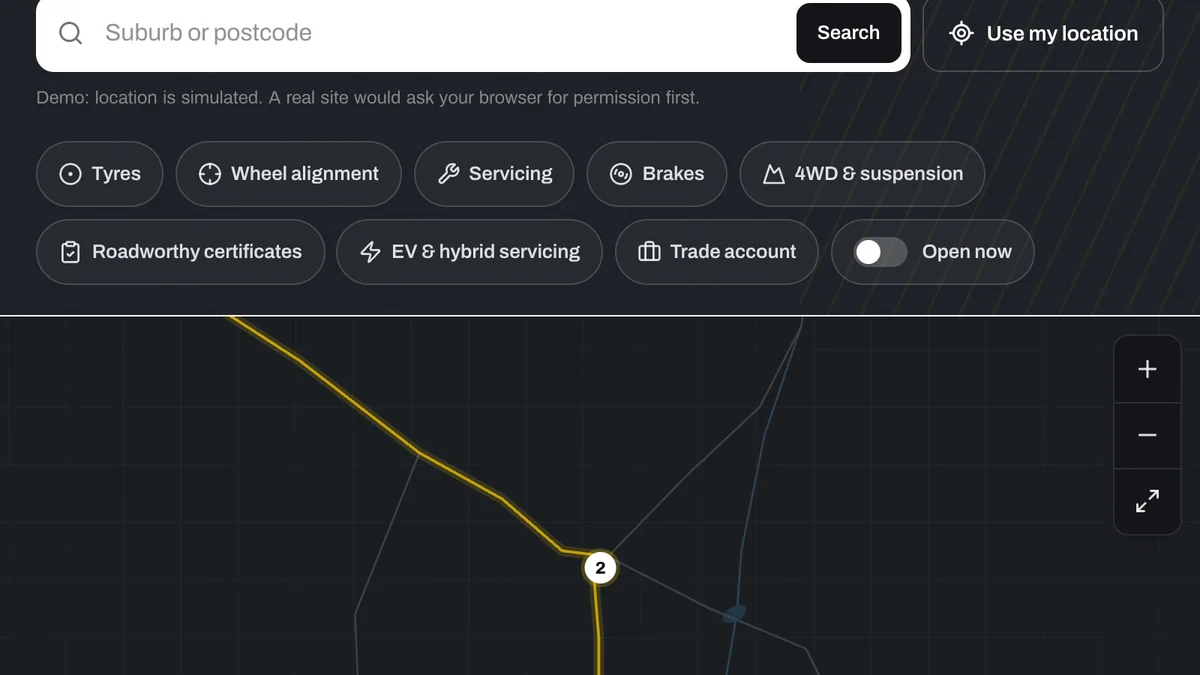
- Chains, franchises and multi-site businessesStore locator for multi-site businessesNearest store, open now, services, stock and a booking, for a regional chain with nine locations.Live demoTry it
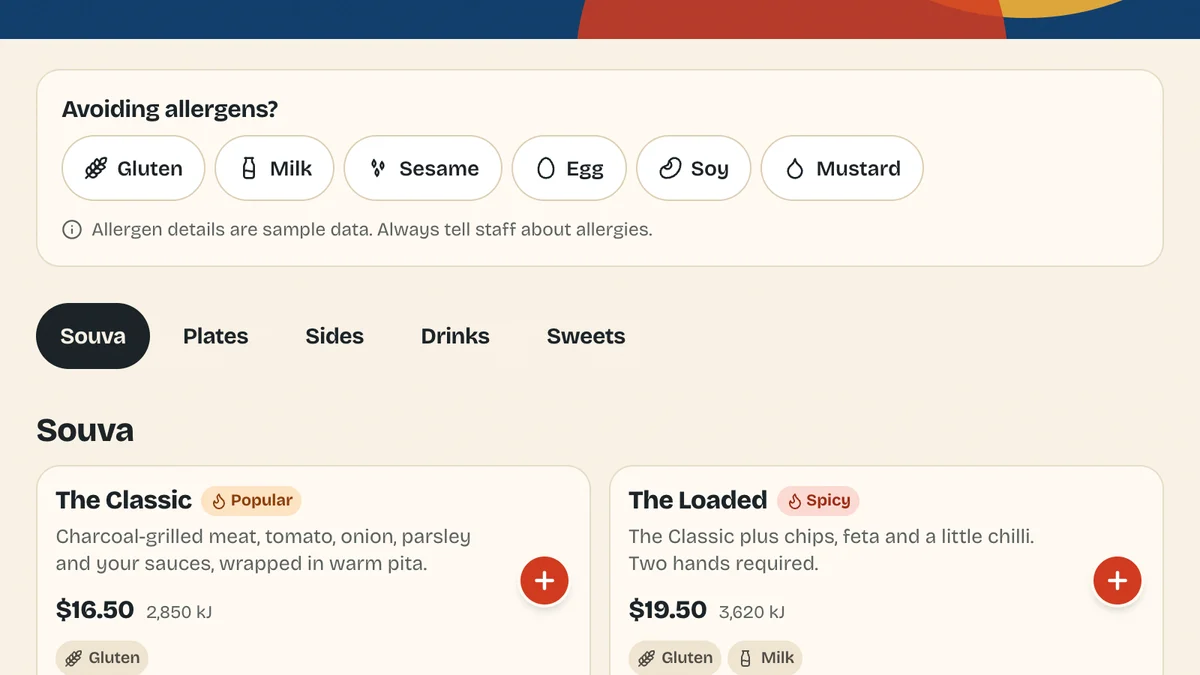
- Quick-service restaurants, cafés and takeawaysOnline ordering for restaurantsCommission-free order-ahead with modifiers, allergens and kitchen-aware pickup times.Live demoTry it
Last reviewed .